
This material is based upon work supported by the National Science Foundation under Grant No. 1253390.

Disclaimer:
Any opnions, findings, and conclusions or recommendations expressed in this material are those of the author(s) and do not necessarily reflect the views of the National Science Foundation.
Adaptive Thermal Management for Next-Generation Implantable Devices
Project Description
Temperature Monitoring and Management Test Vehicle
In order to emulate the implantable medical devices (IMDs) operating in the body environment, while controlling generated heat and accurately measuring the resulting temperature change around the heat source(s), we have designed a temperature monitoring and management test vehicle (TMTV) shown in Fig. 1. Three pulse-width-modulation (PWM)-controlled heat generators and an array of 12 high-precision temperature sensors are interfacing with a microcontroller (MCU) to create a testing platform that allows for emulating heat generation at different locations of an IMD, and monitoring the temperature change around them in teal time. Various dynamic control algorithms can then be employed to manage the operation of the IMD, depending on the environment conditions and application requirements to ensure that temperature in the surrounding tissue does not exceed the safe limit, or if it does, the accumulated heat does not damage the tissue. The TMTV PCB is designed as a slim shape to make it easy to insert into the test body. The prototype is hermetically sealed with Parylene and silicone to allow for immersion in the water, tissue simulant, or actual tissue samples with emulated effects of blood perfusion and other factors that impact heat transfer.
The schematic of the TMTV is presented in Fig. 1a. We adopted the power bipolar-junction-transistors (BJTs, PZT2907A, NXP) with 1.15 W maximum power dissipation as our heat sources. Twelve analog temperature sensors (LMT70, TI) with small size (0.88 mm x 0.88 mm) and high precision (+/- 0.05 ˚C) were utilized to accurately measure the temperature variation within a designated volume. The base terminal of each heat source was driven by the MCU (MSP430) through a 1 kΩ resistor. The supply line and output of each temperature sensor were stabilized with 100 nF and 1 nF capacitors, respectively, to reduce the effect of noise and interference. Following assembly, the TMTV was coated with 3 μm Parylene through a standard process of Chemical Vapor Deposition (CVD). In order to further enhance its hermeticity, 3 mm of the Polydimethylsiloxane elastomer (Sylgard 184 Silicone Elastomer Kit, DOW CORNING) was added homogeneously on the TMTV to further extend the TMTV immersing period in the tissue simulant environment. The fabricated TMTV prototype with coating is shown in Fig. 1c.
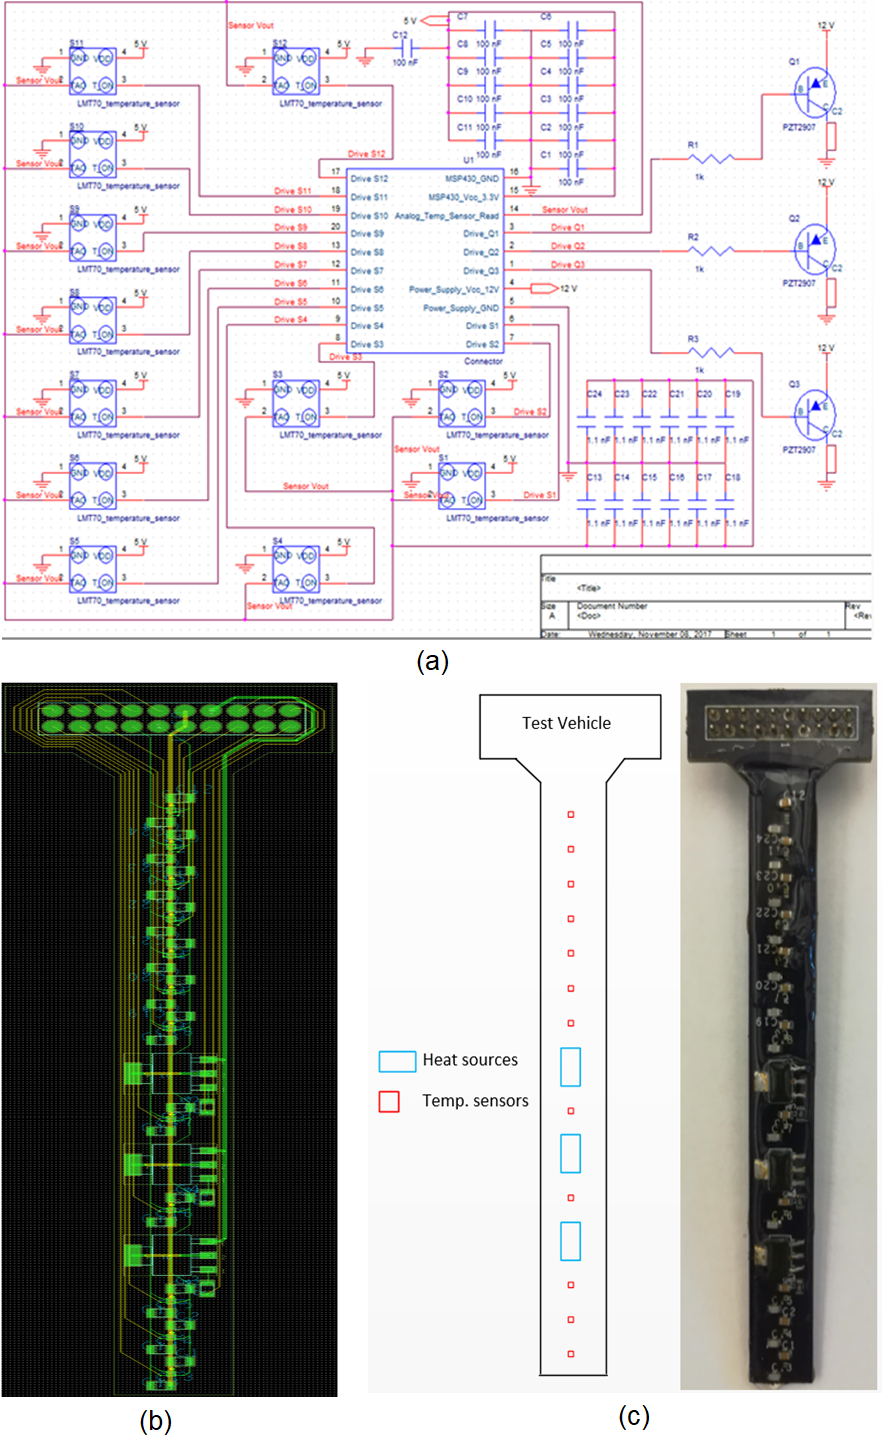
Fig. 1. (a) The schematic diagram (b) PCB layout, and (c) fully assembled and coated temperature monitoring and management test vehicle (TMTV) prototype.
Thermal Management System
To provide an environment to visualize the thermal dynamics of TMTV and for various dynamic control algorithms to interact with TMTV, MSP430G2 is used as MCU to control the heat sources and to record the measured temperatures. In addition, a graphical user interface (GUI) is developed in the LabVIEW environment to interact with MCU and to convert the recorded samples to actual temperature value and display the temperature readouts in real-time. The GUI also allows users to select the reading period of the temperatures sensors and the duty cycle of the PWMs. Users can load any arbitrary duty cycles as text into this GUI, feed it into the heat sources, and record the resulting temperature around the heat sources at 12 different locations in a text file. Fig. 2 shows the interaction between TMTV board, MCU, and LabVIEW GUI. The internal clock modules of MCU are programed to generate different pulse-width-modulation (PWM) outputs to induce different amounts of heat in the heat sources (BJT transistors). The frequency of the PWM is 1 kHz and the minimum pulse width is 1 μs. By changing the PWM duty cycle, the heat source can generate a proportional amount of heat because the voltage across the collector and emitter of the BJT is kept constant at 12 V. The temperature sensors are activated one at a time for 600 μs each to ensure their output signals are stable before sampling by the MCU’s built-in 10-bit analog-to-digital converter (ADC). Every 10 data samples are averaged and stored in the computer through the UART interface.
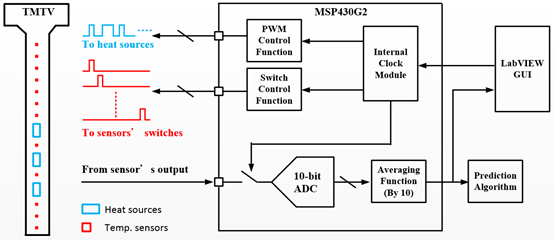
Fig. 2. Illustration of interaction of the temperature management system.
A circulatory water tank is built for emulating the environment in the body with blood perfusion. In the circulatory system, a water-proof pump (Solar circulation pump, 7A015) is utilized to make water circulate at different flow rates by changing its supply voltage. Different flow rates can be used to emulate blood perfusion rates of different body parts. To make the water flows uniformly, we placed a bulky sponge close to the inlet and outlet of the pump and the tube was bored with holes to let water in. The setup of the thermal management system is shown in Fig. 3.
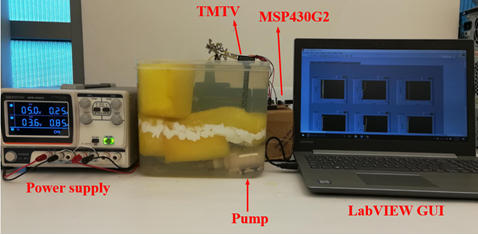
Fig. 3. Setup of the thermal management system.
Predictive Modeling of Bioimplant Thermal Effects
To support the real-time thermal management of bioimplant, a Bayesian recursive multi-step prediction error method (Bayesian RMSPEM) is developed to predict the thermal behavior of the tissue surrounding the bioimplant. The method uses higher order OE type model and updates the model parameters online using regularization techniques given the power consumption of IMDs and temperature measurements within a finite time window. A forgetting factor is incorporated into the updating process to weight less on history data and adapt to the changing thermal dynamics of IMDs. Several Monte Carlo simulation studies are first conducted to evaluate the performance of the proposed method. It is shown that the proposed method is robust to unmodeled dynamics and noise and also the preprocessing data. The prediction accuracy is first demonstrated using thermal dynamics prediction of an IMD simulated using COMSOL, shown in Fig. 4. Then the prediction model is further validated using the experimental data collected from the developed thermal management system, shown in Fig. 5. The results indicate that the proposed method can accurately predicts the temperature change of the device despite the measurement noise.
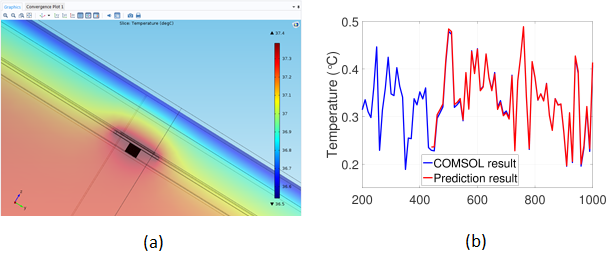
Fig. 4. (a) Cross-sectional view of the IMD simulation in COMSOL, and (b) comparison between the IMD thermal dynamics estimated by the prediction model and COMSOL.
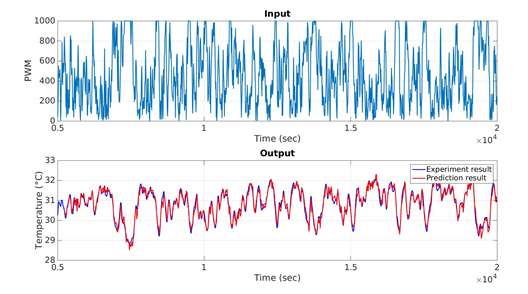
Fig. 5. Comparison between the prediction results and the experimental measurements with randomly generated input to the heat sources.